Problem
A large horizontal vessel, 65 feet in length and 9 feet in diameter, is to be repurposed for hot slurry storage. The vessel will start empty with an initial temperature of -10°C. It is proposed hot fluid be introduced at a temperature of 350°C at a flow rate of 6m 3/hour.
Solution
A transient thermal study was used to simulate filling the vessel by ramping up convection coefficients on split lines that represent different levels of fluid in 2-inch increments. The ramp-up time was calculated for each increment from the flow rate and resulting vessel volume. A gas-off convection coefficient was also applied to all surfaces until fluid would contact the surface. This accounts for the heat transfer from the gas which will come out of the solution upon entering the vessel. A transient stress study was then used to capture stress results from thermal gradients at multiple time intervals matching the thermal study. Preliminary analysis showed undesirable results for shock loading the vessel at the full flow rate and temperature. To produce desirable results a process schedule was developed so the vessel could begin filling during a warm-up cycle. Slurry is to enter the vessel at an initial temperature of 100°C for two hours at a reduced flow rate. After two hours, the flow rate and temperature can be increased over a 4-hour period. The analysis was only conducted up to the 9-hour mark as it was determined to be sufficient for capturing the peak stress that results from thermally loading the vessel.
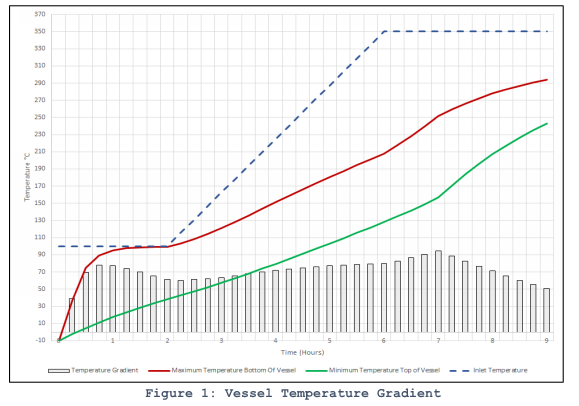
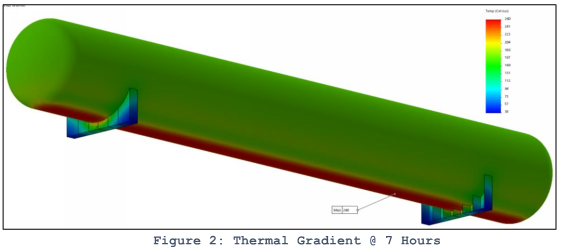
Figure 1 illustrates the top and bottom temperature of the vessel over the 9-hour period. The gradient, or the maximum difference in temperature between the bottom and top vessel surface, is also plotted for visual clarity. It should be noted that while the differential top and bottom temperature doesn’t directly correspond to the resulting stress, it does provide insight on how the vessel could be monitored during start-up and operations. The highest thermal gradient is predicted to be approximately 95°C, this could be monitored to ensure the vessel distributes the heat as predicted. The thermal profile of the maximum gradient is shown in Figure 2.
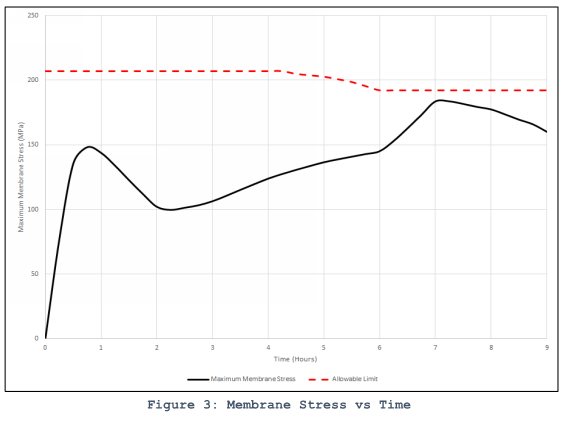
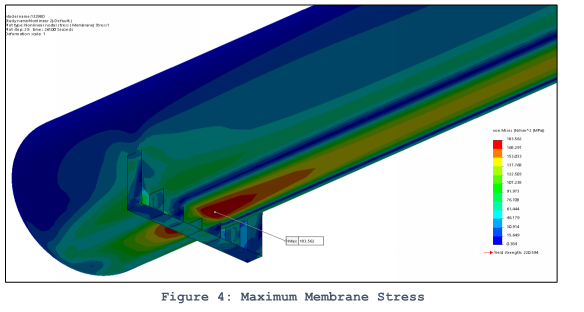
Using a transient analysis to evaluate static stress from the thermal study allows for stress results to be calculated for each time step ensuring the maximum values are captured. Figure 3 illustrates how the membrane stress behaves as the vessel is filled. Maintaining the lower initial inlet temperature of 100°C for two hours prevents the membrane stress from spiking above the allowable limit and allows time for the temperature to distribute and preheat the vessel prior to ramping up to fill design. Figure 4 shows the stress profile and where the maximum membrane stress occurs. Combined stress criteria can also be checked using the same methodology to demonstrate protection against multiple failure modes.